
Annual Meeting Report, August 1st 2024 Click here for NZSA Assessment and Voting Intentions Metric 2021 2022 (restated) 2023 2024 Change Revenue $570.4m $478.1m $493.6m $503.9m 2% NPAT1,2 $21.0m $33.8m $50.5m $15.5m -69% Profit attributable to shareholders $16.8m $23.9m $45.2m $11.8m -74% EPS $0.117 $0.167 $0.315 $0.082 -74% PE Ratio 10 7 5 12 Current…
Read more

Annual Meeting Report, August 2nd 2024 Click here for NZSA Assessment and Voting Intentions Metric 2021 2022 2023 2024 Change Revenue $113.1m $130.3m $156.6m $195.4m 25% NPAT $7.9m $19.8m $10.6m $15.6m 47% EPS $0.074 $0.19 $0.102 $0.149 47% Inventory Turnover 2.28 2.04 2.20 2.34 6% Gross Margin 43% 47% 47% 45% -3% PE Ratio 60…
Read more
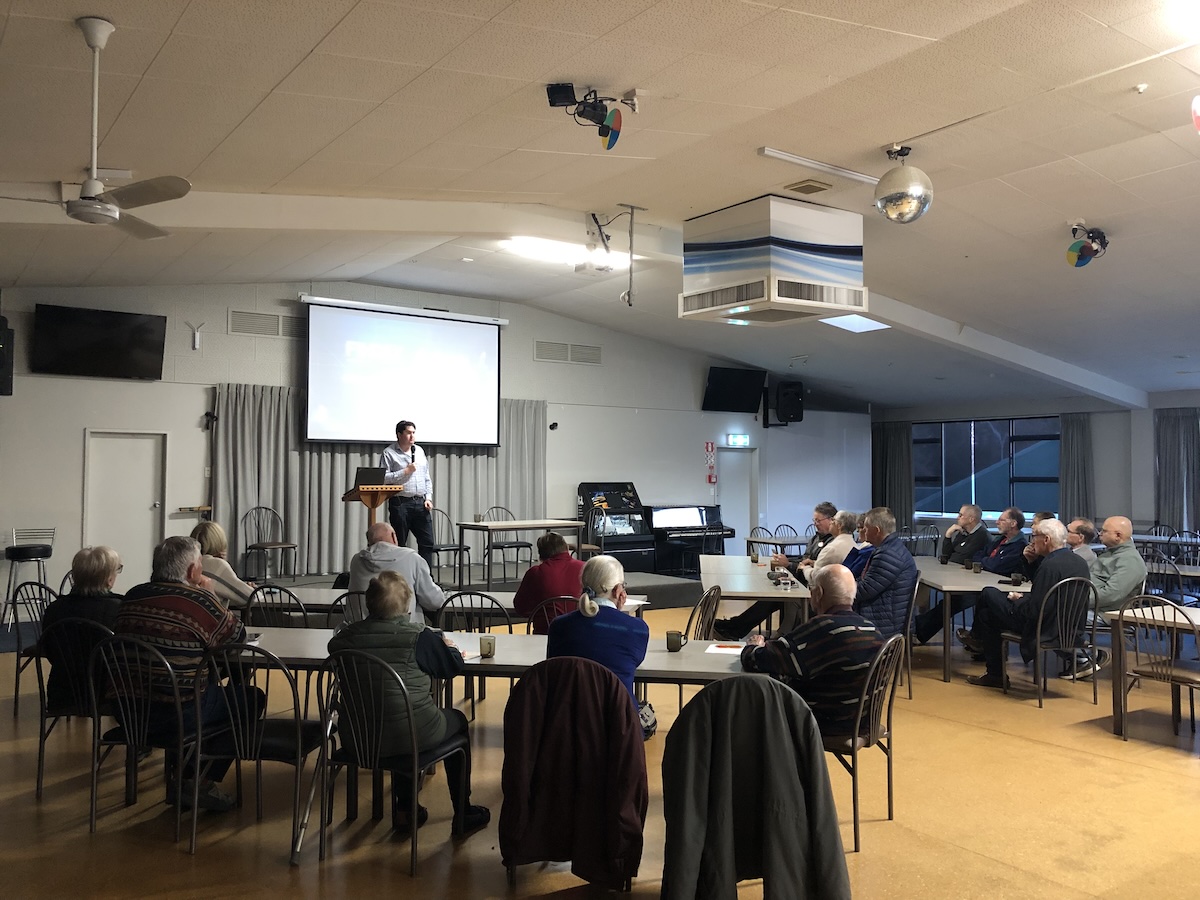
NZSA Disclaimer Branch Event Report – talk by Richard Muth – Findex Taxation of Investments, Foreign Investment Structures, Traders vs Capital, August 2024 There was a reasonable turnout for this talk by Richard Muth on the dry subject of taxation of investments, with particular emphasis on foreign investments. Richard is a taxation specialist with Findex…
Read more

Annual Meeting Report, August 16th 2024 Click here for NZSA Assessment and Voting Intentions Metric 2021 (rest) 2022 2023 2024 Change Share price $1.33 $0.83 $0.19 $0.155 Revenue $190.7m $193.9m $175.7m $162.2m -8% NPAT 1 $16.5m $20.0m $7.9m $6.0m -23% EPS 1 $0.068 $0.083 $0.032 $0.025 -23% PE Ratio 1 19 10 6 6 Capitalisation $322m $201m $46m…
Read more

Annual Meeting Report, August 8th 2024 Click here for NZSA Assessment and Voting Intentions Metric 2022 2023 2024 Change Revenue $0.7m $1.4m $4.1m 183% Gross Profit $0.2m $0.7m $2.9m 313% NPAT -$4.3m -$6.9m -$5.4m n/a Gross Profit Margin 26% 49% 71% 46% EPS1 -$0.123 -$0.195 -$0.10 n/a PE Ratio n/a n/a n/a Capitalisation $37.1m $15.2m…
Read more

NZSA Disclaimer The author is the Head of Regulation at Catalist Public Market. All opinions expressed within this article are solely the author’s and do not reflect the opinions, beliefs or positions of Catalist. From an NZSA perspective, this is a topic we are interested in simply as a means of striking a better balance…
Read more

Special Meeting Report, July 31st 2024 Click here for NZSA Assessment and Voting Intentions As announced to the market on 24 April 2024, Promisia has entered conditional agreements to acquire the Golden View Lifestyle Village for a purchase price of $29.3m and acquire the Ripponburn Lifestyle Village for a purchase price of $4m. Both are…
Read more

Special Meeting Report, July 11th 2024 Click here for NZSA Assessment and Voting Intentions This was always going to be a very ‘special’ meeting as newly-minted Chair George Adams has finally done what none of his immediate predecessors managed to do, in starting the pathway to Synlait’s financial resurrection. The “end of the tunnel” (with…
Read more

Annual Meeting Report, July 26th 2024 Click here for NZSA Assessment and Voting Intentions Metric 2021 2022 2023 2024 Change Gross Profit $2.3m $4.5m $7.7m $8.2m 6% NPAT $0.08m $1.3m $2.3m $2.6m 17% EPS1 $0.0005 $0.0063 $0.0062 $0.0072 17% PE Ratio 112 9 12 10 Capitalisation $17.9m $11.9m $28.0m $28.0m n/c Current Ratio 1.33 1.42…
Read more

Annual Meeting Report, July 25th 2024 Click here for NZSA Assessment and Voting Intentions Metric 2021 2022 2023 2024 Change Revenue $3,543m $5,218m $5,675m $4,717m -17% NPAT $188.1m $355.4m $426.5m $208.7m -51% EPS $1.87 $3.53 $4.24 $2.07 -51% PE Ratio 41 20 17 34 Capitalisation $8.1b $7.9b $7.1b $7.0b n/c Current Ratio 1.08 1.17 1.22…
Read more