Standard and Poors (S&P) are the company behind many of the stock market indices that are used as benchmarks for portfolio performance – including our own local S&P NZ50 Index. Recently, Anu Ganti, Senior Director, Index Investment Strategy was in New Zealand – and I went along to have a listen.
S&P’s role in setting and managing stock market indices means that the company has a vested interest in the power of index (passive) investing – but nonetheless, the concepts and tools highlighted below are relevant for all investors actively managing their own portfolio (skip to the summary at end of this article if you want to skip the analysis and find out why).
There was plenty to take away from the session – some aspects that might be relevant right now, while others indicate longer-term trends for investors. For example, as a short-term sidebar to her main presentation, Anu Ganti noted the current under-performance of ‘value’ stocks, with ‘growth’ focused stocks being back in vogue – representing a complete reversal from 2022.
But – back to the main event.
First – de-mystifying the lingo
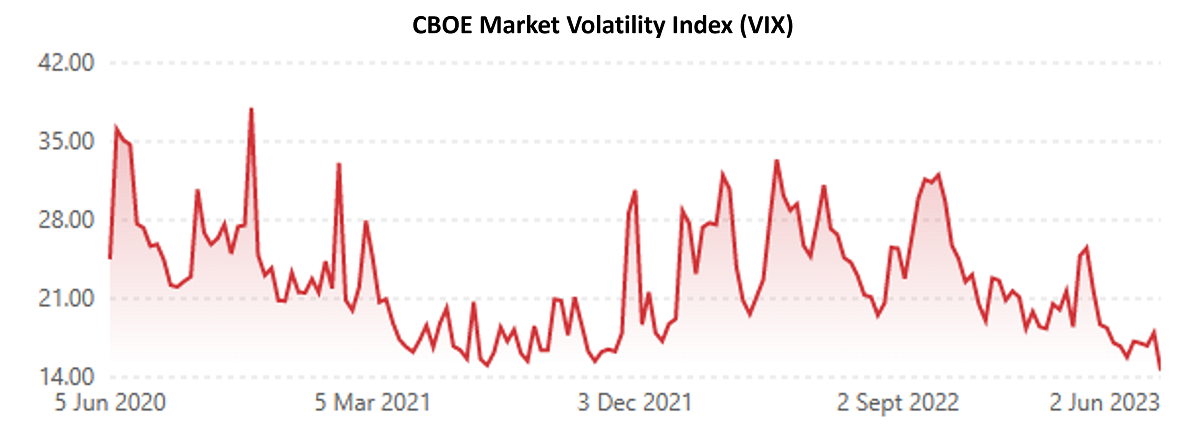
In a time of increased market volatility, it’s often said that “stock pickers” outperform others; the better an investor’s ability to pick specific companies that will perform in a downturn, the better their return. Yet, right now, indicators of global volatility are actually relatively low. The well-known CBOE Market Volatility Index – better known as VIX – might not quite be at the low-levels of the pre-Covid bull market, but is nonetheless not far above that norm. The Index has consistently declined during 2022 and 2023. VIX measures the forward pricing (on a 30 day basis) of options linked to S&P500 shares. Unsurprisingly, there’s no NZ equivalent; our relatively low levels of liquidity and the lack of a forward market make it difficult to measure expectations of market volatility.
Whether down to low actual market volatility (regardless of perception), Anu Ganti argues that the real skill right now is in picking the right sectors rather than the actual stocks. And that comes down to a concept known as dispersion. This measures the degree of performance variability amongst stocks. The greater the variation of return, the greater the dispersion. And in turn, the greater the degree of dispersion, the greater opportunity for investors to outperform.
The rise of thematically-focused exchange traded funds (ETF’s) – sector-based index funds – provide a vehicle for retail investors to implement their own sector-based strategies.
Correlation to market returns may help investors come to terms with timing of when to trade a particular stock; ie, is it trading above or below its ‘natural’ level given the market index and its own share price .
So, if focusing on sectors with high dispersion is the way to create opportunity for active investors and managers, what does the data say about the recent performance of active managers?
SPIVA – S&P Indices vs Active Funds
A somewhat forced acronym perhaps…but useful nonetheless. SPIVA is S&P’s own way of measuring the performance of active managers against core indices. They do this in a number of markets around the world, including our near and dear neighbour. So given the market difficulties of the last 2-3 years, we’d expect active managers to be way ahead, right?
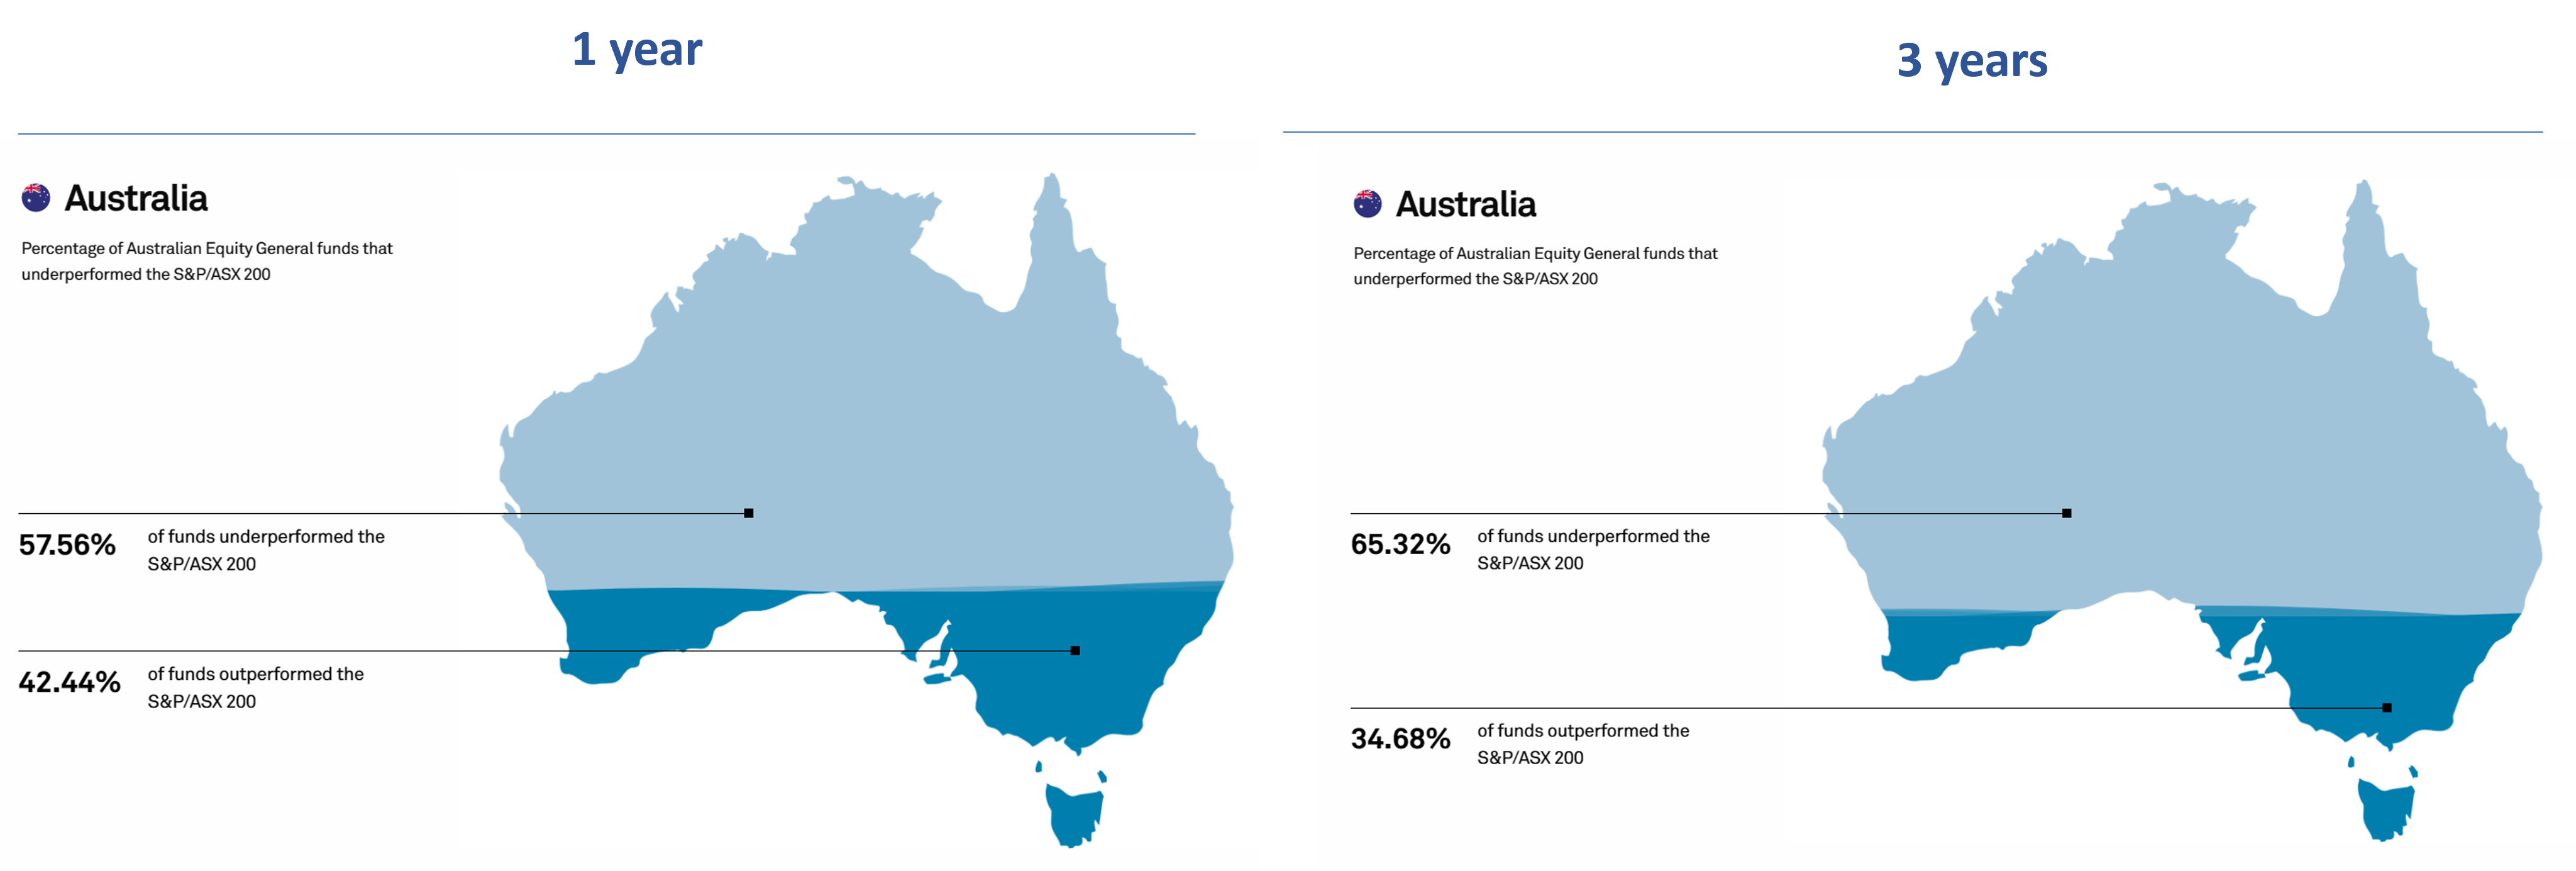
Wrong.
Essentially, the further back you go, the worse the collective performance of active managers. It might be that they performed slightly better over the past year, providing some affirmation to the assumption that active managers do better in a bear market. But even so – over half of active managers under-performed the market benchmark.
S&P don’t officially measure the performance of NZ fund managers, due to a small sample size and limited liquidity. However, they’ve performed some unofficial measurement that bears out the same trends as shown above. Similarly, the rest of the world follows the same pattern.
Maybe if you’re with the ‘right’ active manager you’ll still do better than market? Unsurprisingly, S&P have a measure for that as well, called a Persistence Scorecard. Nope, that’s not the constant hum created by the sound of your son wanting to borrow the car, that’s the consistency with which an active fund manager remains in the top quartile of returns performance.
Almost no Australian funds remained in the top performance quartile within their category over five consecutive years
Australia Persistence Scorecard: Year-End 2022 – SPIVA | S&P Dow Jones Indices (spglobal.com)
So, no good news on that front either.
Why is this so hard?
S&P cite three key factors that make it harder for active managers to outperform a long-term market return.
- “Skewness” of active manager fund returns
Essentially – a market outperformance is driven by only a few companies. S&P’s data shows that this is just as applicable in New Zealand as it is globally. That means that returns are not aligned against a “normal” distribution.
- Cost
We all relate to this one. Active fund managers generally require a higher cost base to perform their analysis, resulting in higher fees for investors. It’s all too easy for market outperformance to be swallowed up by fees.
- Professionalism
As capital markets are tending towards greater involvement of funds and their managers, that is leading to increased capability within the industry created by both smart people and available information – making it harder to ‘beat’ competitors.
Data – the great ‘leveller’ between retail and institutional investors
It’s that latter point relating to ‘professionalism’ that stands out as a key reason why retail investors have the opportunity to outperform markets. In 2023, and indeed for the two decades that have come before, we have lived in a very ‘connected’ world. Retail investors can take advantage of the same types of market data and assessments that are used by professional fund managers – and take their own decisions.
The availability of data is a great leveller.
Earlier, I highlighted the key quantitative concepts of volatility, dispersion and correlation. In 2023, it’s possible to use an Excel formula to determine ‘beta’ (ie, a measure of correlation with market), we’re able to use market tools to visually compare stocks and shares with each other and tools like Sharesight (amongst others) provide a view of sector returns. Volatility is easily viewed via a ticker code. Measuring dispersion may appear harder – but with the use of some automated Excel formulas and some publicly-available databases, most investors could achieve this to some extent.
At a qualitative level, NZSA works hard to ensure that companies are setting a level playing field for all investors, whether institutional or retail.
As retail investors, we shouldn’t be afraid of not achieving the levels of return that an active fund tells us they can achieve. As the data shows, more than half of them won’t beat the market anyway.
In fact, the plethora of funds available puts a retail investor very much in the driving seat. Even if an individual investor is investing solely via passive funds, they have the opportunity to manage those passive funds in a very active way to maximise their own assessments of opportunity.
For example – an asset allocation could include selected sector ETF’s, with some diversification provided through geographically-based passive ETF’s and a selection of companies that an investor believes could be on the ‘top end’ of returns within their sector – and yes, why not place a portion of your portfolio with an active manager? A hypothetical allocation perhaps, but the purpose is simply to demonstrate that the plethora of investment vehicles has simply put the power back in your hands.
Oliver Mander
Oliver appreciated the opportunity to attend this CFA Society event, provided by Kernel Wealth Management. For more regular updates from S&P, check out their Indexology blog, with plenty of regular fetaures and evidence-based updates.